EDUCATIONAL BIOINFORMATICS PROJECT
OncoMap
Breast Cancer Bioinformatics Explorer
A focused view of public breast-tissue gene-expression data, with probe-level results kept visible for careful interpretation.
TARGET PANEL
BRCA1BRCA2TP53ERBB2
PIK3CAESR1PTENEGFR
RESEARCH QUESTION
How do selected breast cancer-associated gene-expression probes differ between normal breast tissue and breast cancer tissue?
BIOLOGICAL CONTEXT
Why This Research Matters
The selected genes connect to several themes often studied in breast cancer. These are useful ways to organize the question, not claims that one expression measurement explains a tumour.
DNA repair
BRCA1 and BRCA2 are associated with repairing damaged DNA and maintaining genome stability.
Cell growth signalling
ERBB2, PIK3CA and EGFR are linked to pathways that transmit signals involved in cell growth and survival.
Tumour suppression
TP53 and PTEN are associated with cellular controls that can limit abnormal growth.
Hormone receptor signalling
ESR1 encodes the estrogen receptor alpha, which is involved in hormone-responsive signalling.
PROJECT WORKFLOW
Project journey
- 01Public dataset selection
- 02Data inspection
- 03Probe annotation
- 04Gene selection
- 05Differential-expression analysis
- 06Scientific visualisation
- 07Interactive exploration
INTERACTIVE TABLE
Gene explorer
LOCAL FILE / GEO2R
Load differential-expression results
Select Data/processed/GSE42568.top.table.tsv from your computer. The file is read in this browser only.
No file loaded yet. Choose the GEO2R TSV to view real probe-level results.
0 matching probes
| GEO2R gene symbol |
|---|
DIFFERENTIAL EXPRESSION
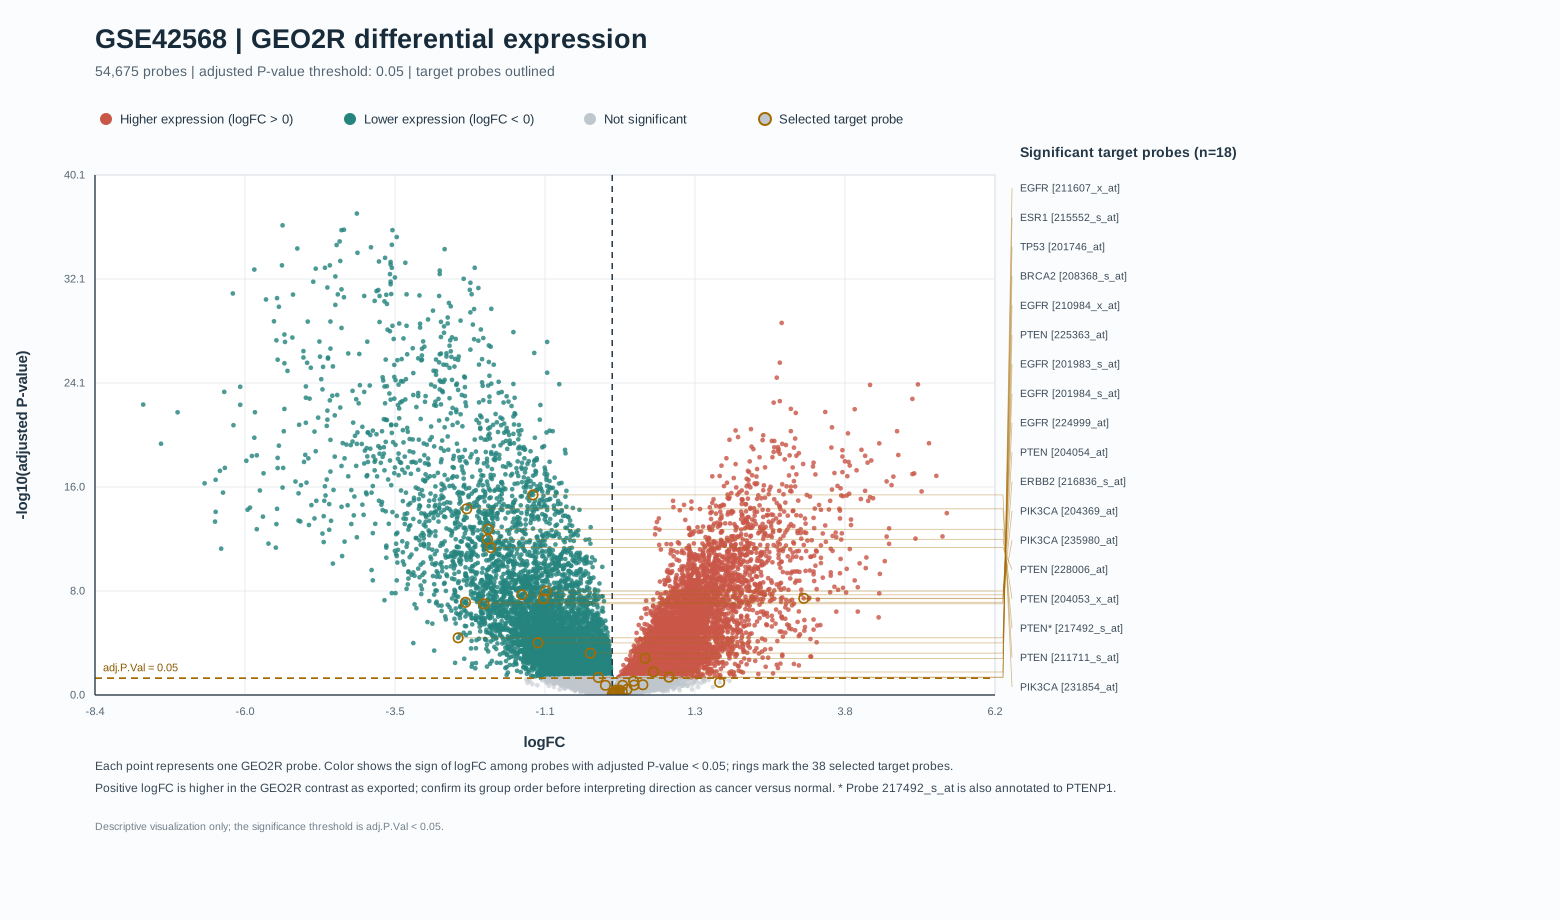
Volcano plot
Wide figure: scroll horizontally to inspect the details.
SAMPLE-LEVEL PATTERNS
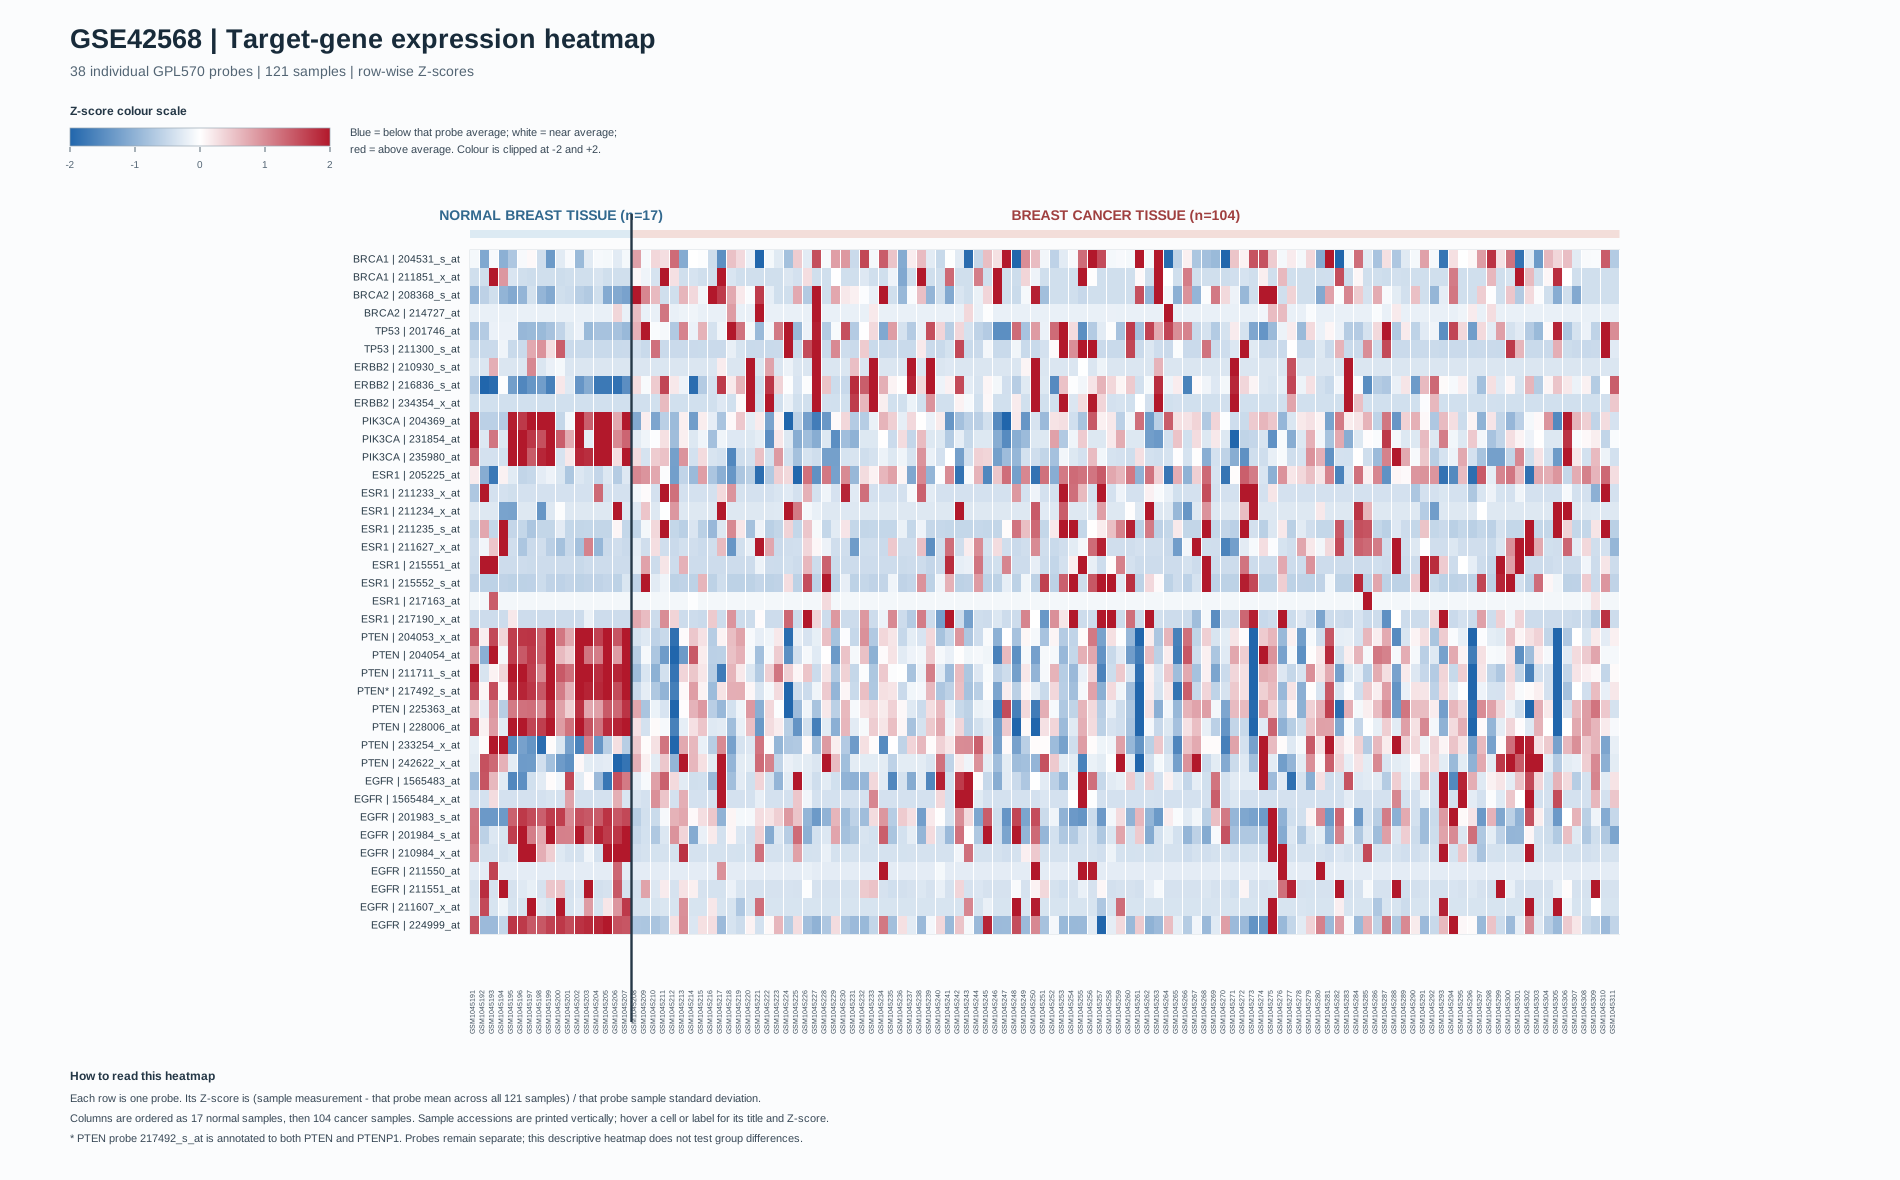
Gene-expression heatmap
Wide figure: scroll horizontally to inspect the details.
EXPLORATORY SUMMARY
Research findings
These observations come from the supplied GEO2R table for the eight selected genes. They describe individual probe rows, not combined gene-level measurements.
18 significant probes / 38adj. P-value < 0.05
Significant probes with negative logFC
For the cancer-versus-normal contrast, these probes have lower reported measurements in cancer. This includes all 3 PIK3CA probes, 6 of 8 PTEN probes, and 5 of 9 EGFR probes.
Significant probes with positive logFC
One probe each for BRCA2, TP53, ERBB2, and ESR1 has positive logFC. The other probes for those genes do not pass the threshold.
Selected probes not below the threshold
These probes have adjusted P-values of 0.05 or higher. Their direction alone should not be described as a statistically significant difference.
STUDY CONTEXT
Methodology & limitations
Public microarray study
NCBI GEO Series GSE42568, measured with the Affymetrix Human Genome U133 Plus 2.0 Array (GPL570). The series contains 121 samples: 104 breast cancer and 17 normal breast tissue samples.
Processed measurements
The GEO2R results are based on GC-RMA processed array measurements. The table remains probe-level; the annotation file provides probe-to-symbol mappings, including some one-to-many mappings.
GEO2R / limma
GEO2R uses the limma framework to estimate differential expression. Adjusted P-values use the Benjamini-Hochberg procedure to account for testing many probes. The dashboard displays the supplied results and does not rerun this model.
Use as an exploration, not a conclusion
The groups are imbalanced, and clinical or technical factors may affect measurements. Multiple probes can represent a gene, annotations can be ambiguous, and these results need independent validation. No diagnostic or treatment decisions should be made from this project.